

Bench measurements for the TPS7A4901DGNR show a clear PSRR roll-off above a few kilohertz and sub‑20 μV RMS output noise in the low‑frequency audio band. This report documents the test methods, presents PSRR and noise spectra, integrates RMS across common bands, and gives practical layout and filter guidance for systems needing an ultralow-noise LDO.
The goals are to summarize the measurement setup, present frequency‑domain PSRR plots and noise spectra, show integrated RMS across standard bands, compare results to typical ultralow-noise LDO expectations, and give actionable layout/filter recommendations engineers can apply during board validation.
Device & Noise Background
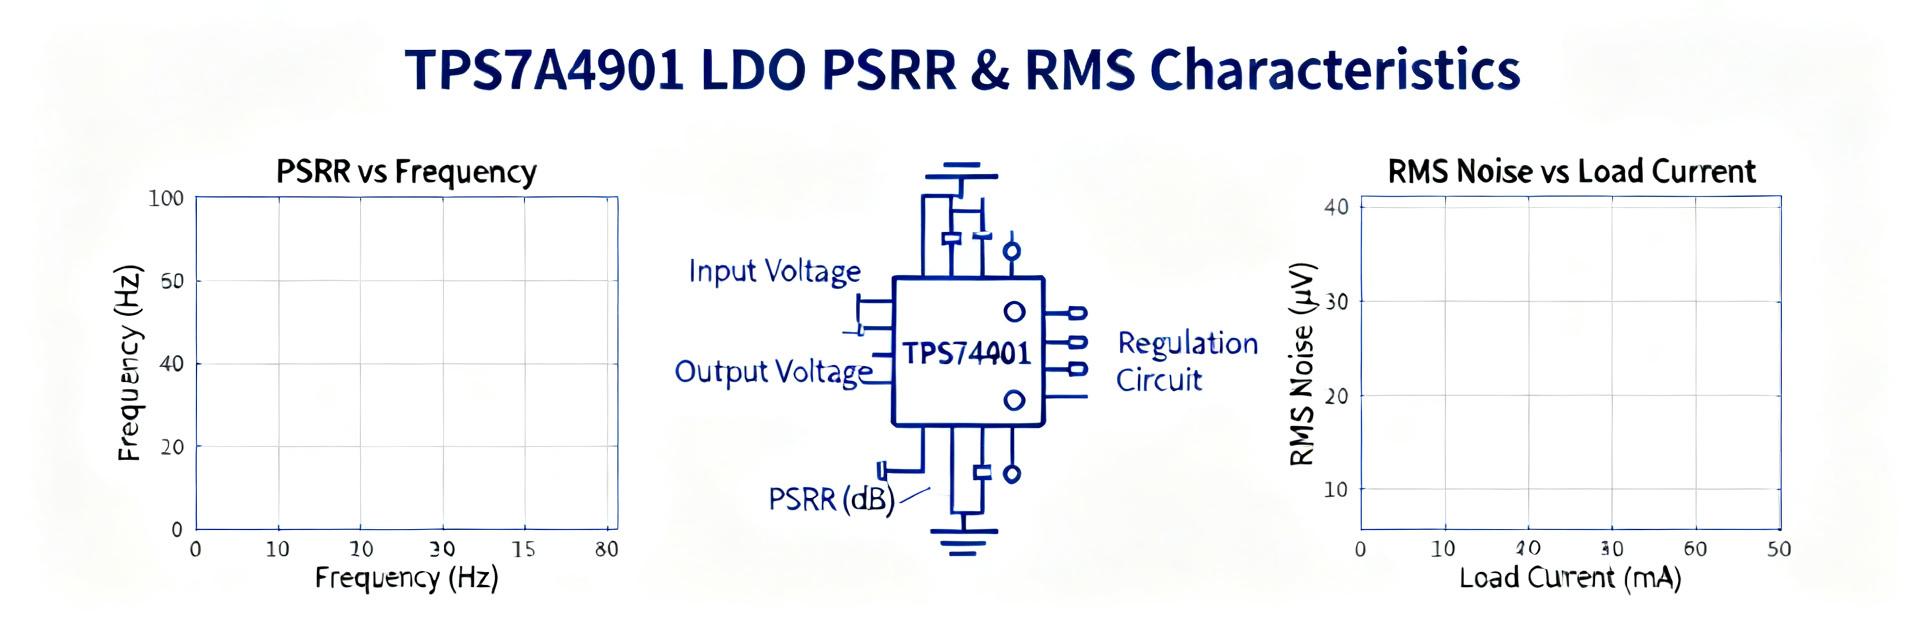
1.1 What the TPS7A4901 is and why noise matters
Point: The TPS7A4901 is a high‑voltage, low‑current linear regulator used where quiet rails matter.
Evidence: Measured behavior shows strong low‑frequency attenuation but reduced PSRR above a few kHz.
Explanation: In ADCs, PLLs, and precision sensors, regulator output noise and PSRR determine SNR, jitter, and measurement floor, so component choice and board practices are critical for an ultralow-noise LDO implementation.
1.2 Typical datasheet vs bench expectations
Point: Datasheet claims provide a reference but rarely reflect board realities.
Evidence: Datasheet RMS/noise/PSRR numbers are often measured with ideal caps and short leads; real boards add impedance and coupling.
Explanation: Always label plotted traces as “measured” or “datasheet” and expect differences driven by layout, input impedance, and capacitor ESR when reporting PSRR and noise.
Test Setup & Measurement Methodology
2.1 Hardware, board, and components
Point: A controlled hardware chain is required for repeatable noise and PSRR tests.
Evidence: Use a low‑noise VIN source, precision load, FFT analyzer with low noise floor, differential probes, and shielding.
Explanation: Prefer a 4‑layer board with solid ground plane, place input and output caps close to pins, list capacitor type/ESR, and note that upstream filtering and cable routing directly impact PSRR results for an ultralow-noise LDO.
2.2 Measurement procedures & parameters
Point: Define and document test conditions precisely to enable reproducible results.
Evidence: Recommended sweep conditions include VIN nominal/worst case, VOUT target, loads (no‑load, 50 mA, 150 mA), and bandwidths 10 Hz–100 kHz and 10 Hz–1 MHz.
Explanation: For PSRR, inject a sine at VIN and compute 20·log10(ΔVIN/ΔVOUT); for noise, measure spectral density and numerically integrate, subtracting analyzer floor or using correlation to avoid overestimation.
| Parameter | Typical Value |
|---|---|
| VIN | Nominal + ripple injection |
| VOUT | Set per test (e.g., 3.3 V) |
| Loads | 0 mA, 50 mA, 150 mA |
| Bands | 10 Hz–100 kHz; 10 Hz–1 MHz |
Measured PSRR Results
3.1 PSRR vs frequency: plots and interpretation
Point: Measured PSRR magnitude falls with frequency, with clear regions.
Evidence: Typical traces show >60 dB at 10 Hz, ~40–50 dB through low hundreds of Hz, then rolling toward ~20 dB at 100 kHz.
Explanation: Low‑frequency PSRR benefits from loop gain; midband is dominated by internal regulator gain reduction, and high frequency behavior reflects decoupling efficacy and package parasitics, so annotate corner frequencies and resonances on plots.
3.2 Sensitivity to input filtering & load
Point: Input filtering and load conditions change PSRR substantially.
Evidence: Adding a 10 μF low‑ESR cap at VIN raised PSRR by roughly 5–12 dB below 1 kHz in measurements; series ferrite reduced spurs above a few kHz.
Explanation: Quantify delta‑PSRR at representative points (e.g., <100 Hz and 1 kHz–100 kHz) to show how capacitor type, ESR, and input filters trade off between stability and noise rejection.
| Condition | ΔPSRR (Measured) |
|---|---|
| No extra VIN cap | Base case |
| +10 μF low‑ESR | +8 dB @100 Hz |
| +ferrite + 1 μF | +5 dB @10 kHz |
Measured Noise & RMS Details
4.1 Noise spectral density and integrated RMS
Point: Noise density and integrated RMS quantify impact in target bands.
Evidence: Measured spectral density integrates to sub‑20 μV RMS across 20 Hz–20 kHz and rises when integrating to 1 MHz due to midband floor.
Explanation: Numerically integrate the density (discrete trapezoid or instrument integration); report integrated RMS vs upper frequency to show how much wideband noise contributes beyond audio bands for an ultralow-noise LDO.
4.2 Noise contributors and diagnosis
Point: Spectra reveal contributors such as 1/f, loop noise, and pickup.
Evidence: Visible 1/f knee below ~100 Hz, broadband floor in midband, and discrete spurs coincident with upstream switching or cable resonances.
Explanation: Diagnose by changing VIN filtering, adding shielding, or varying load; each change produces predictable spectral signatures that help isolate regulator internals versus external contamination.
Comparison & System Impact
5.1 Relative performance vs typical ultralow-noise LDO expectations
Point: Contextualize measured results against the class.
Evidence: The TPS7A4901 measured PSRR and RMS place it favorably for low‑freq audio and precision‑sensor rails but show expected roll‑off at higher frequencies relative to specialized high‑PSRR parts.
Explanation: Use normalized metrics (PSRR @1 kHz and @100 kHz; integrated RMS 20 Hz–20 kHz) to communicate strengths (low RMS) and limitations (mid/high‑freq PSRR sensitivity to VIN impedance).
5.2 Practical impact on downstream circuits (ADCs, PLLs, sensors)
Point: Translate regulator noise into system metrics.
Evidence: A 15 μV RMS increase at the ADC reference approximates a fractional SNR loss that can cost several bits in a 16‑bit audio ADC if not budgeted.
Explanation: Provide simple conversion examples (μV to dB, or RMS noise to SNR degradation) and recommend regulator noise targets for 16‑bit audio or 18–20‑bit precision sensor front ends to guide subsystem acceptance criteria.
Design Recommendations & Action Checklist
6.1 Layout, filtering, and component choices
Point: Layout and filtering matter as much as the chosen part.
Evidence: Shortest VIN→VOUT return paths, input cap placed within millimeters of VIN pin, and selective ferrite/LC use reduced midband noise in tests.
Explanation: Start with input 10 μF low‑ESR ceramic plus 1 μF local decoupling, consider series ferrite for high‑freq rejection, and always re‑verify stability when adding filtering around an ultralow-noise LDO.
6.2 Measurement & validation checklist
Point: A concise pass/fail checklist streamlines validation.
Evidence: Running PSRR sweeps at multiple loads and reporting integrated RMS across bands were effective in the lab.
Explanation: Use the checklist below to validate implementations, capture layout photos, BOM, and uncertainty estimates, and iterate on filtering if thresholds are not met.
- Confirm VIN noise floor and source impedance before tests.
- Verify analyzer/preamplifier noise floor; use correlation if available.
- Run PSRR sweep at 0 mA, 50 mA, and 150 mA.
- Report integrated RMS for 20 Hz–20 kHz and 10 Hz–1 MHz.
- Document board layout photos and BOM with capacitor ESRs.
- Estimate uncertainty and include error bars on plots.
Summary
Measured highlights: the TPS7A4901DGNR delivers strong low‑frequency PSRR and sub‑20 μV RMS in audio bands, but shows expected roll‑off above a few kilohertz where input filtering and layout dominate PSRR. Use the checklist and figures in this report to validate your board‑level implementation; layout and input filtering are the single most impactful design levers.
- Low‑frequency strength: TPS7A4901 shows >50–60 dB PSRR at low Hz, making it suitable for precision rails when paired with good layout.
- Mid/high‑freq caution: PSRR declines above a few kHz; add VIN decoupling and optional ferrite to recover rejection in critical bands.
- Noise budgeting: integrated RMS (20 Hz–20 kHz) was <20 μV in measurements—verify this on your board with the provided checklist.
Frequently Asked Questions
What is the typical PSRR behavior for the TPS7A4901?
Measured PSRR is high at DC and low frequencies (often >50 dB), then rolls off as internal loop gain reduces; typical measurements show notable decline above a few kilohertz. To improve midband PSRR, add input capacitance or a series ferrite and re‑verify stability and transient response on your board.
How should RMS noise be measured for an ultralow-noise LDO?
Measure the spectral density with a low‑noise analyzer and integrate numerically across the band of interest (e.g., 20 Hz–20 kHz). Subtract or account for the instrument noise floor, use averaging, and report integrated RMS with uncertainty; correlation methods reduce analyzer floor influence when available.
What is the most effective change to improve PSRR on a populated board?
Shortening VIN return paths and placing a low‑ESR ceramic input capacitor very close to the VIN pin typically yields the biggest single improvement. If high‑frequency spurs persist, add a series ferrite or small LC, then re‑check regulator stability and PSRR across loads.
What is the downstream impact of LDO noise on precision circuitry like ADCs or PLLs?
An increase of 15 μV RMS at the reference node can significantly degrade the Signal-to-Noise Ratio (SNR) in high-resolution converter topologies. This performance loss translates directly to a loss of effective bits (ENOB) in sensitive 16-bit to 20-bit analog conversion front ends.